
IELTS Writing Pie Charts
Join my IELTS telegram channel
Pie charts sometimes come up in the IELTS academic writing task 1. When they do, you either get several pie charts, or a pie chart in addition to some other chart. In this guide we look at multiple pie charts.
Strategy
If you practise writing pie chart questions using the following strategy, you should have no problem writing a good response quickly in the IELTS exam.
Step 1: Understand the Charts
The first thing you need to do is understand what is going on. It can be helpful to take a minute before you write anything and just try to understand the data.
Although they are usually used to show a snapshot, pie charts can be used to show changes over time when multiple pie charts are being used. In this case each pie chart would should a different time.
Otherwise the pie charts will be related in another way, possibly showing different areas of the world as in the example in this guide.
Step 2: Write the Introduction
The introduction for any academic task 1 can be made up of:
- paraphrasing the description of the data;
- an overall trend.
Paraphrasing
In your first sentence you need to paraphrase the description provided of the pie charts. The description may look like this:
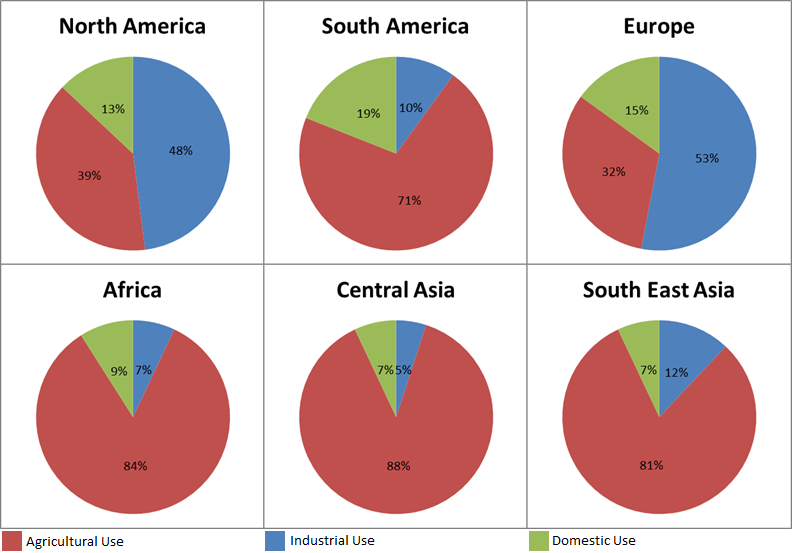
The charts below show the percentage of water used for different purposes in six areas of the world.
We need to take the ideas in this sentence and put it into our own words:
The pie charts provided compare the different ways water is used in six regions.
Note the different ways I have used to paraphrase the original sentence:
- the charts –> the pie charts
- below –> provided (because it is not on the same paper as my answer)
- show –> compare
- percentage of water used for different purposes –> the different ways water is used (changing structure of sentence)
- six areas of the world –> six regions
Overall Trend
As with other task 1 reports, to find an overall trend, we can identify the subject of the charts and look at this on the whole. In this case it is the three uses of water: industrial, agricultural and domestic. On the whole, most of the regions’ main use of water is for agricultural purposes, while the use of water in homes (i.e. domestic use) is the smallest use.
Percentage of water used for different purposes in six areas of the world
Step 3: Write the Body
In the body paragraph, you need to describe in more detail the information in the pie charts. The following tips will help you to do this.
Describe Similar Pie Charts Together
As you can see the pie charts for North America and Europe look very similar, as do the charts for Africa, Central and South East Asia. South America is somewhere in the middle.
Use Numbers
You should make use of the numbers provided in the pie charts. You can refer to several regions being within a range for some uses e.g. the bottom three are in the range of 7-9% for domestic use.
Don’t be afraid to use fractions or ratios to mix up the use of numbers and show your flexible lexical range. For example, agricultural use of water in Europe is just under a third.
Step 4: Write the Conclusion
As with the other task 1 reports, you should conclude by finding a key comparison. In this case we can compare the regions and say for example that North America and Europe use around half of their water for industrial purposes, while the vast majority of water in the other regions is used for agricultural purposes.
Practice Questions
Click here for all IELTS writing task 1 practice questions and sample answers.


